k8s-buddy

A little friend that watches
your Kubernetes clusters

k8s-buddy floats on your desktop and sits in your menu bar, keeping an eye on every context in your kubeconfig. When something breaks, it nudges you and shows you exactly what's wrong.

Free for everyone. Enjoy! ๐ŸŽ‰

macOS ยท Windows ยท Linux  ยท  open source (Apache 2.0)  ยท  no account, no telemetry

The k8s-buddy overview: 22 clusters monitored, and a list of things that need a look, most important first.

Everything you check by hand, at a glance

Point it at your kubeconfig and it starts watching. Nothing to install in your clusters.

๐Ÿ‘ป

Floating buddy

Stays on top of your windows, bounces and shows a count when something new breaks. Click for the alert history, drag it anywhere.

โŽˆ

Every cluster at once

A multi-cluster overview of all your kubeconfig contexts: health, nodes, pods and what needs a look first.

๐Ÿšจ

Alerts that matter

CrashLoops, restarts and OOMKills, unschedulable pods, stuck PVCs, NotReady nodes, failing certificates and Helm releases. Snooze or mute any of them.

๐Ÿ“…

Kubernetes end-of-life

Warns two months before your control plane's version goes out of support, and again one month out. Version cards show how far behind you are.

๐Ÿ—‚

Resources, any CRD

Browse workloads, networking, storage, config, Helm releases, nodes, events and any custom resource, with summaries, describe, YAML and a console.

๐Ÿ“Š

Requests vs limits vs usage

Live CPU and memory from the metrics API, side by side with requests and limits, and as sortable bars in the Pods list.

๐Ÿ“œ

Logs that read well

Stream one container, or every pod of a workload merged with a colour per pod. ANSI colours and timestamps included.

โฐ

CronJobs in plain English

"Every day at 02:00" instead of 0 2 * * *, with the next runs in your time and UTC.

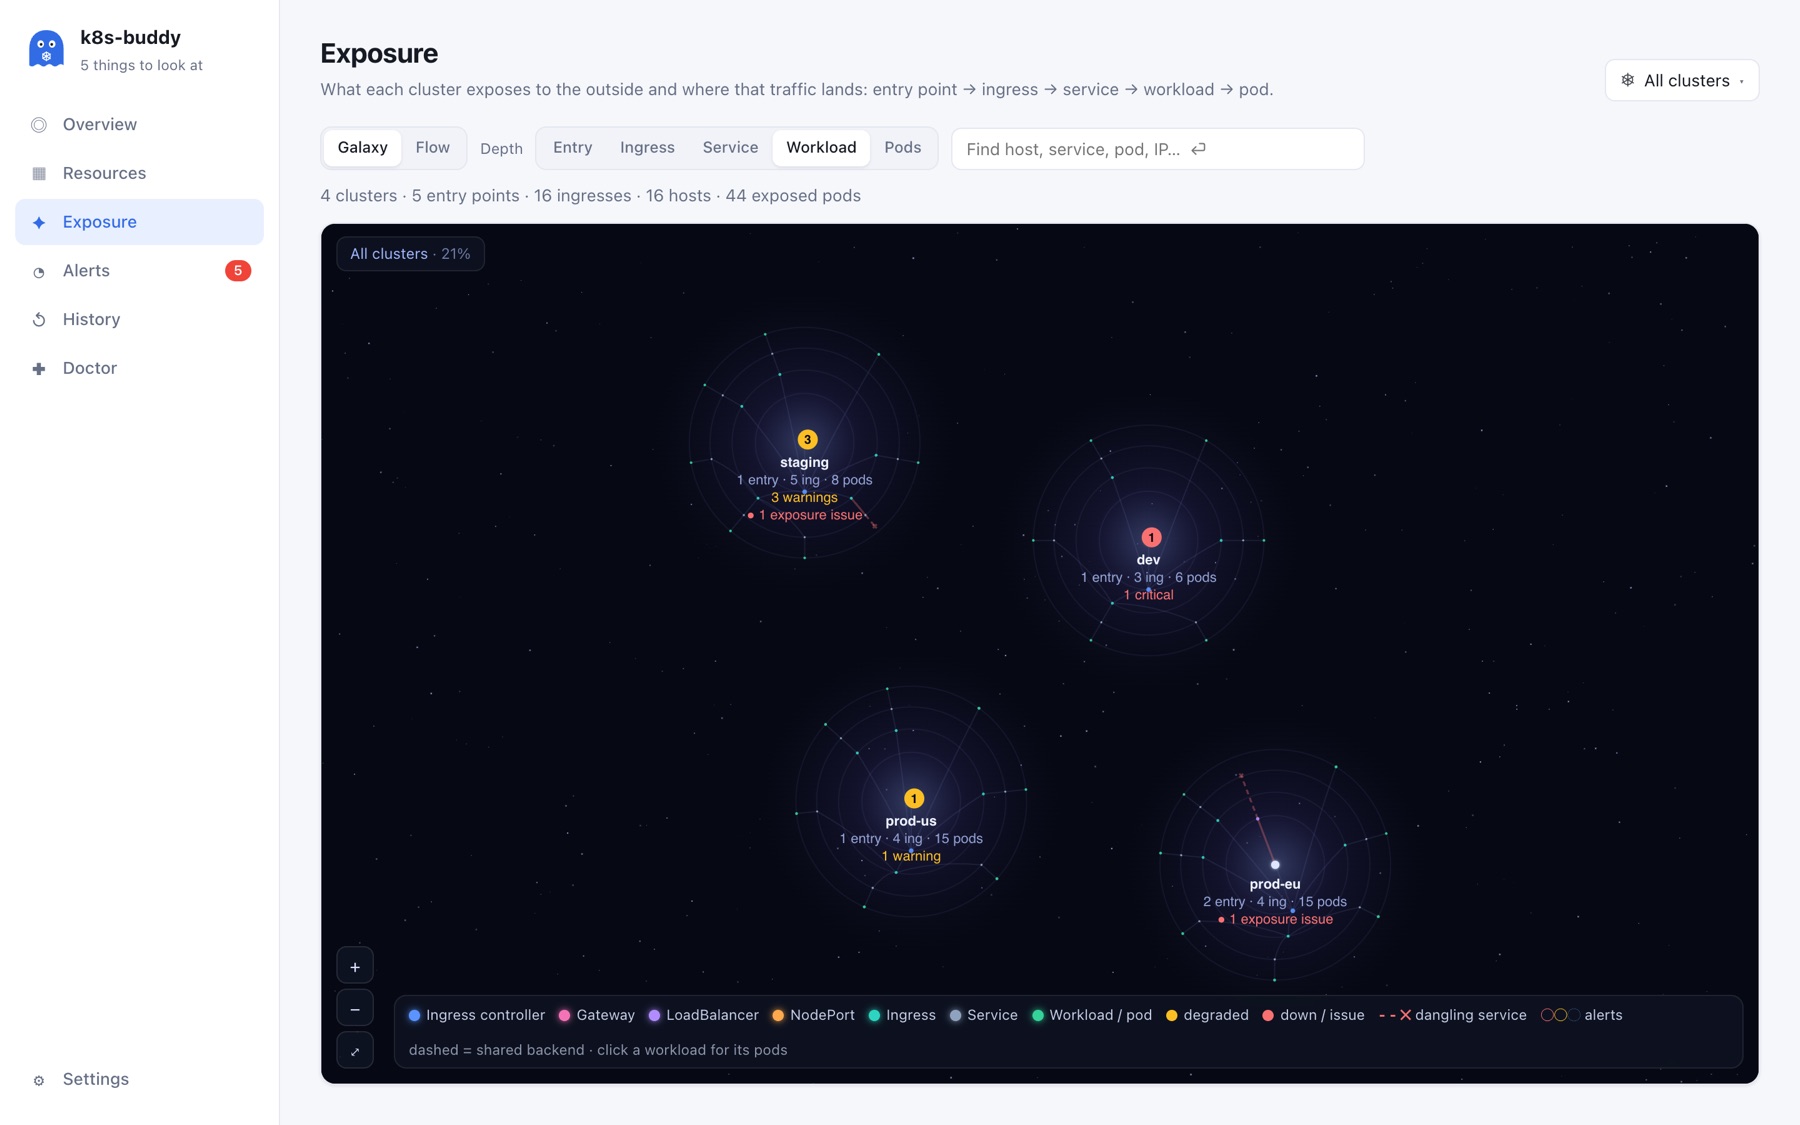
โœฆ The exposure map

See what each cluster exposes and where that traffic lands: entry points โ†’ Ingresses and Gateway API routes โ†’ services โ†’ workloads โ†’ pods.

  • A zoomable galaxy of all your clusters, or a left-to-right flow
  • Services that lead nowhere are drawn in red
  • Alerts show up right on the map
The exposure galaxy: each cluster drawn as a star system with its entry points, ingresses and pods, and alert badges.

๐Ÿ”Ž Every object, explained

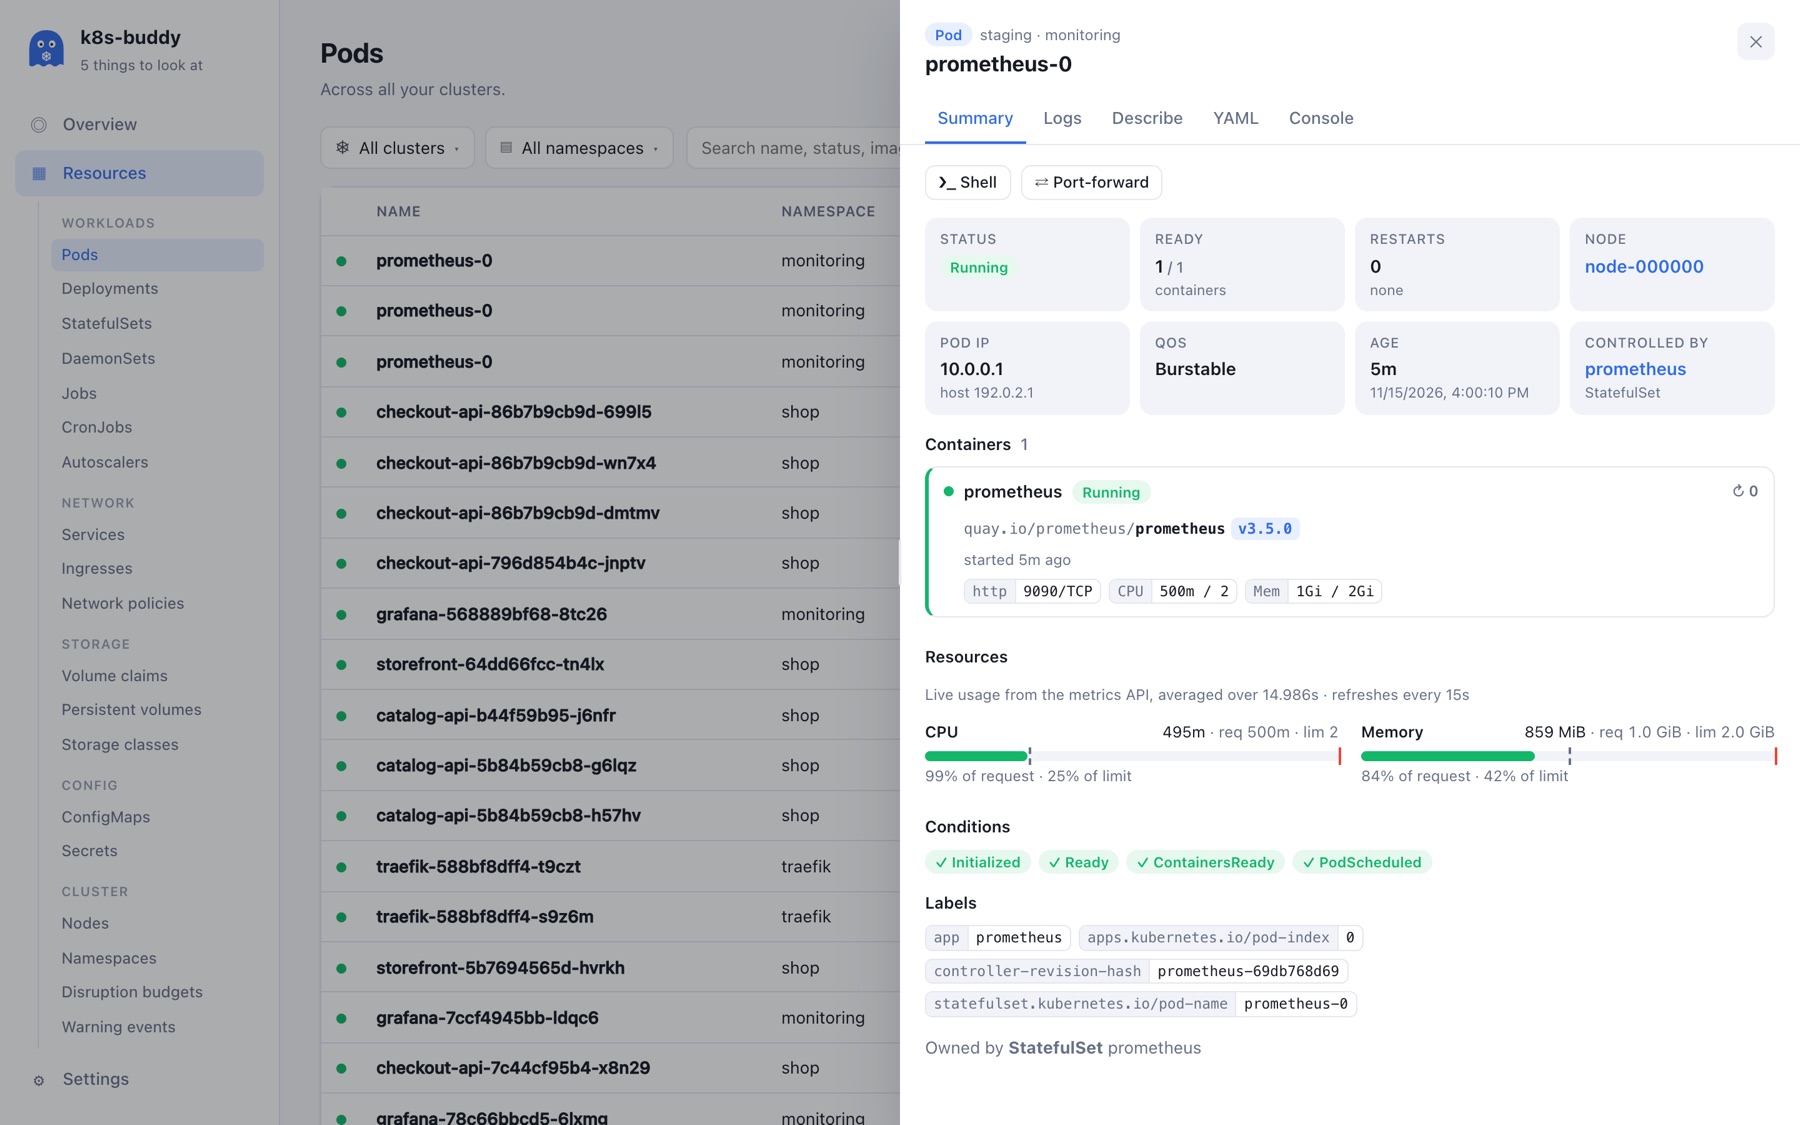
Open any pod, workload, alert or finding for a readable summary: status, containers, conditions, labels, and live usage against requests and limits.

  • Logs, kubectl describe, YAML and a console
  • Helm values on demand
  • Secret values are never downloaded unless you reveal a key
A pod opened in k8s-buddy with its status, container, live CPU and memory usage bars, conditions and labels.

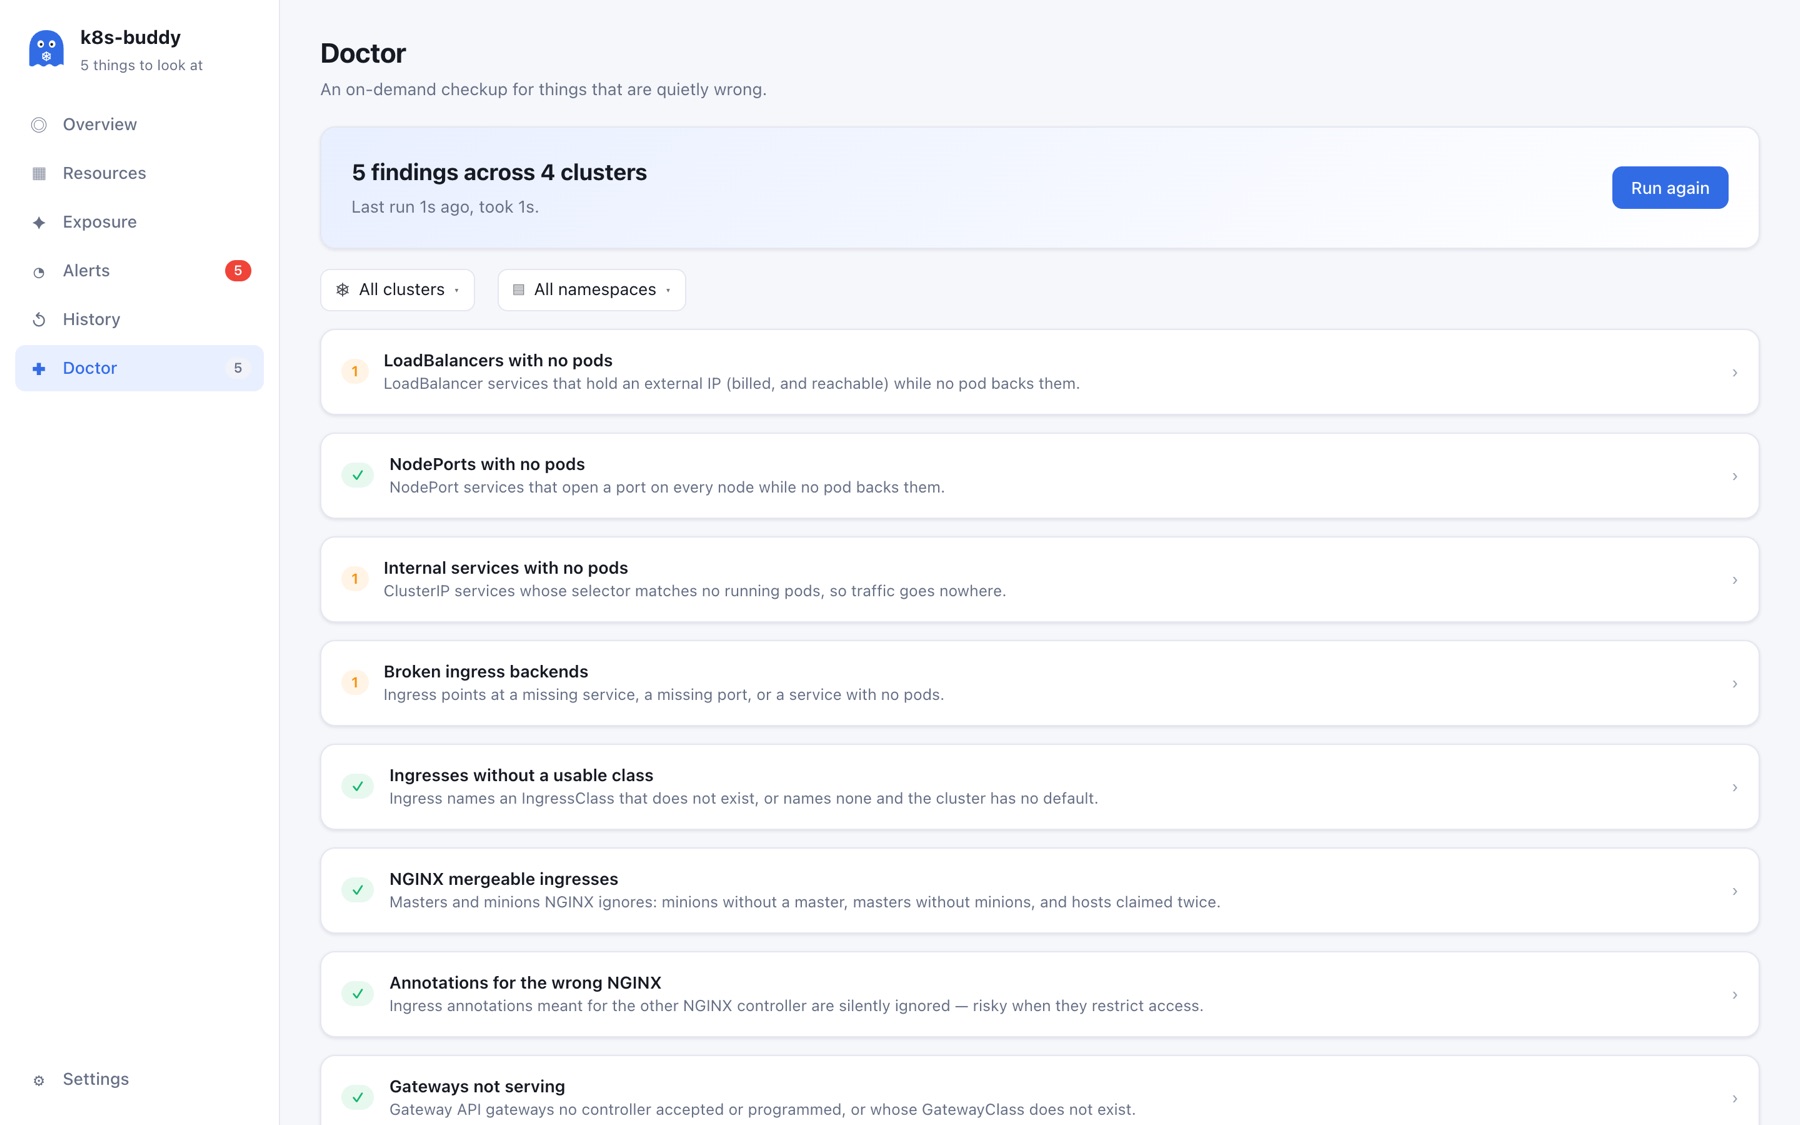
โœš Doctor: a checkup on demand

Finds the things that are quietly wrong and never page anyone:

  • Dangling services and LoadBalancers with no pods
  • Broken ingresses and Gateway routes
  • PodDisruptionBudgets that will block upgrades
  • Orphaned volumes, leftover pods, versions near end-of-life
The Doctor view listing findings such as LoadBalancers with no pods and broken ingress backends.

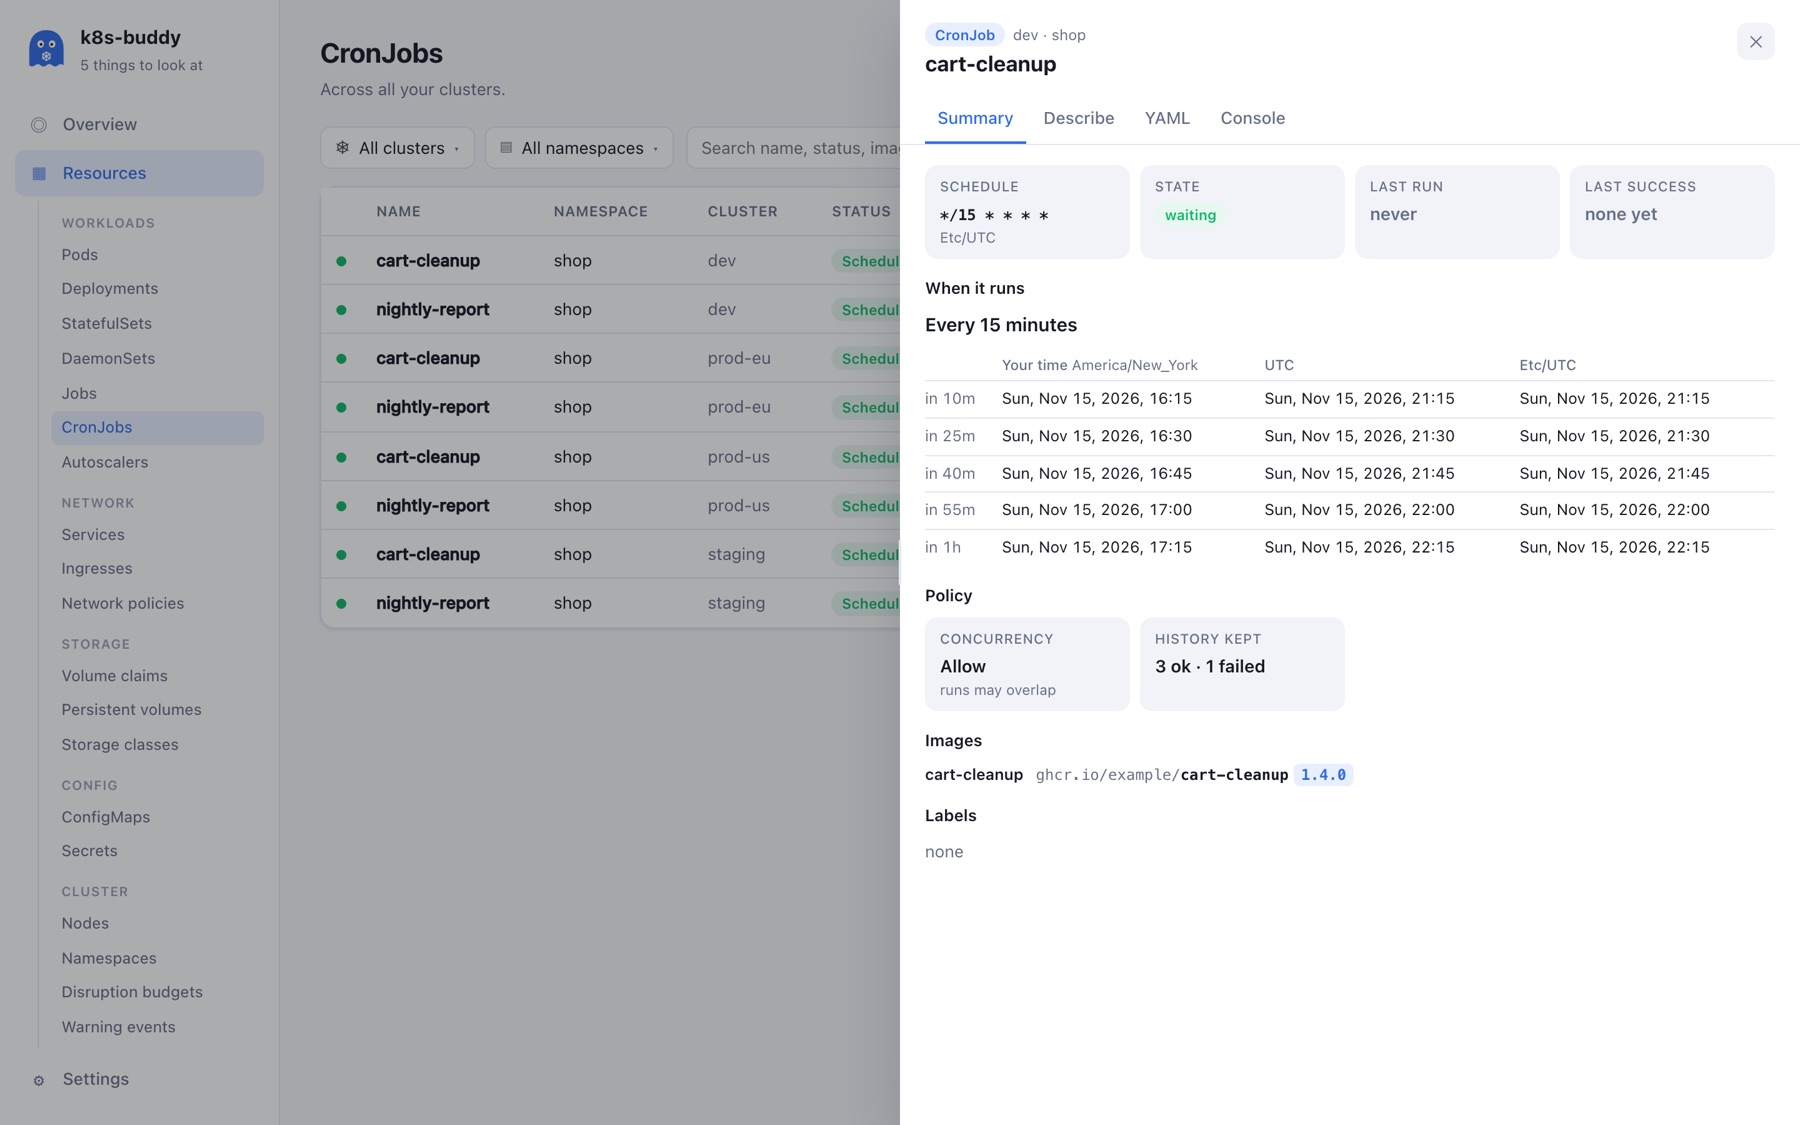
โฐ CronJobs you can read

Every schedule in plain English, with the next five runs in your time zone and UTC, plus recent history and the concurrency policy.

A CronJob opened in k8s-buddy: schedule */15 explained as 'Every 15 minutes' with the next five runs in local time and UTC.

Screenshots show demo clusters with sample apps.

Safe by default

It's a monitor, not a remote control.

Read-only monitoring

It only lists and watches. The built-in console asks before anything that changes a cluster.

Secrets stay secret

Secret values are never loaded unless you explicitly reveal one key.

Runs on your machine

Uses your kubeconfig and your credentials. No account, no cloud service, no tracking.

Download

Free for everyone. Grab the build for your system from the latest release.

Prefer building it yourself? make app. See the README.